Polymer-assisted clarification followed by staged ozone oxidation for high-strength, starch-rich wastewater. Clarification first, oxidation second — move the easy solids out before ozone demand climbs.
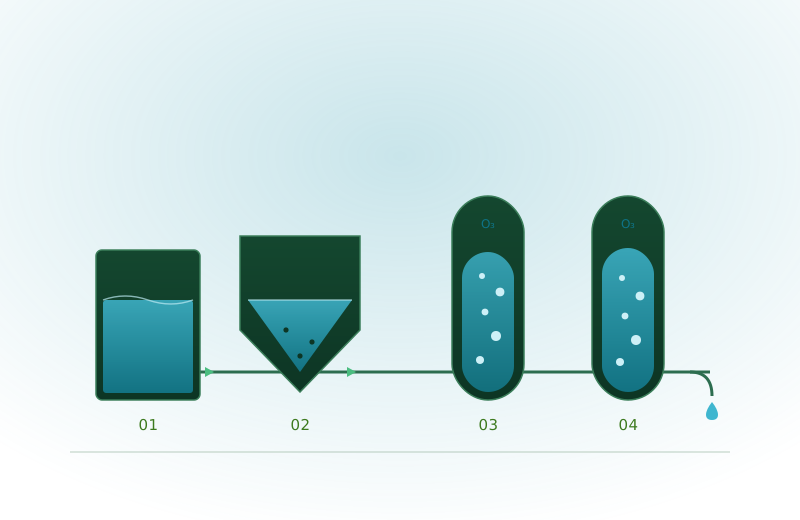
Capture easily separable particles before ozone demand becomes too high — that keeps the oxidation stages efficient and focuses the strongest claim on clarification and organic-load polishing.
Equalise flow, pH and suspended load so downstream stages see a stable feed.
Capture particles and particle-bound organics — the main solids-removal step.
Begin oxidation and colour/odour reduction on the clarified stream.
Improve endpoint organic-load removal — the strongest COD/BOD₅ signal.
Mean endpoint removal across three test rounds on cassava starch plant data. The final endpoint indicates high removal efficiency for solids and organic load — with nitrogen removal only partial.
All figures are removal efficiency (%), calculated relative to the control sample within each round — not raw analytical values.
Avg removal efficiency · a cassava starch plant · n=3 where averaged. Influent/effluent concentration ranges available under NDA.
Across three supplied test rounds, solids and organic-load removal remained the strongest endpoint signals. Nitrogen remained partial, which is why the platform is positioned as a clarification and polishing front-end rather than a universal treatment claim.
After Ozone 2 · mean across three screening rounds
For high-strength, starch-rich agro-industrial wastewater, the Water Recovery Platform shows strong efficiency for solids and organic-load reduction under the tested conditions. Sell first as a retrofit module or pilot package, then expand into turnkey systems after controlled validation.
The current dataset does not support claims of complete nitrogen removal or universal disinfection. Those require additional biological nutrient-removal and/or dedicated disinfection validation before any compliance-oriented claim is made.
Public figures are removal efficiency. Everything a technical or compliance buyer needs beyond that is scoped and answered during a structured pilot on your own effluent.
What TSS, COD, BOD₅, TN and pH range does the feed swing across? We characterise the envelope before sizing.
Which discharge limit or reuse standard must the effluent meet? The target sets the required stages and endpoint.
What clarified sludge volume is produced, and what is the dewatering, haulage or beneficial-reuse plan?
What is the ozone dose and energy draw per m³ at the target endpoint — a primary operating-cost driver.
Which coagulant/flocculant chemistry and dose the feed responds to, and the resulting consumable cost.
All-in treated-water cost — chemicals, energy, sludge and service — confirmed on continuous-flow pilot data.
Same source batch, matched treatments, triplicates.
Polymer dose, ozone dose, contact time, ORP, pH.
Continuous flow, 3–5 test days minimum, mass balance.
Cost per m³, sludge plan, service model and warranty limits.
Some samples were collected on different days and times. Current results should be treated as promising screening evidence — not bankable validation. Compliance requires controlled testing and site-specific regulatory review.
Position the Water Recovery Platform as a retrofit module today, then validate to funder- and customer-grade claims through a structured pilot.